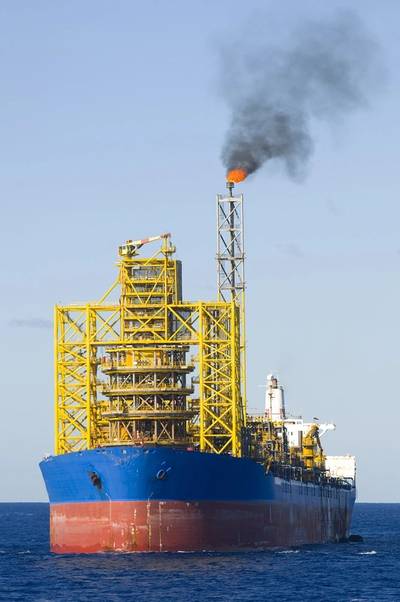
IMA/World Energy Reports has just completed a comprehensive assessment of the five year outlook for the deepwater sector. The new report – the 19th annual floater market forecast prepared by IMA since 1996 – provides our forecast of orders for floating production systems between 2016 and 2020. Here’s an overview of the findings and conclusions in the report.
Bottom Line
We see the downturn in market conditions and implosion of Petrobras as a bump in the road. While the outlook is clearly dimmer than last year, there is a large backlog of planned projects requiring floating production systems – and the long term fundamentals to support investment commitment in these projects remain very solid. But the next 12 to 24 months will test the resilience of field operators and contractors in the deepwater supply chain.
The Current Situation
After four decades of rapid growth, the deepwater sector has suddenly stumbled. Very few orders were placed in 2015 for floating production systems. Only two FPSOs have been ordered since January of this year– compared to 12+ orders annually over the past decade. The downturn in orders reflects the general unraveling in industry conditions. Virtually every company in the supply chain feels threatened by business softness. Capital expenditures are being sliced and deepwater project starts deferred. Personnel reductions are being announced on a daily basis, rig contracts are being cancelled or renegotiated, assets are being written down.
What happened?
Behind the downturn is an imbalance in oil supply and demand brought on by the emergence of shale/tight oil and inability of major producers to coordinate a ramp-down of global output. A huge oversupply of oil is in the market. The result has been a plummeting of oil prices over the past year – reducing cash flow and prompting oil companies to severely cut back on capital expenditures to conserve cash.
Add to this the implosion within Petrobras. The major player in the deepwater sector has been largely taken off the field by a corruption scandal. More than a third of expected FPSO orders over the next five years were to be generated by Petrobras. But the company’s financial problems have caused a massive cut back in planned project starts. In 2014 Petrobras was planning to acquire13 additional FPSOs for project starts between 2018/20. Now it is planning to acquire five FPSOs – and questions remain about the ability to finance even this reduced number of FPSOs.
Is a Rebound Likely?
Absolutely! Clearly there will be a rebound in the deepwater sector. It will be driven by increasing global oil demand and need to find new sources of oil to replace depleting sources. Global oil demand has been growing at an average rate of 1.4 percent annually over the past 20 years. With the exception of two years during the global financial meltdown, oil demand has increased year over year during this period.
Looking forward, industry analysts differ on the rate of future oil demand growth, but not on whether growth will continue. For example, the IEA sees world oil demand in 2040 growing to 104 mb/d, an increase of 10 mb/d over current consumption. The EIA predicts global oil/liquid fuel consumption will grow to 119 mb/d by 2040, a 30 percent increase over the present. OPEC expects oil demand to grow to 111 mb/d in 2040, up 18 percent from global oil consumption in 2015.
Among the oil majors, ExxonMobil expects an average growth of 1.2 percent in oil demand through 2025, followed by a 0.5 percent growth between 2025 and 2040. BP calls for world oil demand to grow at an average rate of 0.8 percent annually through 2035. Ultimately new oil sources will be needed to accommodate this demand growth – as well as replace supply losses as depleting oil fields come off line. Deepwater is among those new sources.
What Will Drive the Rebound?
We are tracking more than 240 offshore oil and gas projects in the planning stage that likely require a floating production system for development. Some of these projects will require multiple systems. If all projects proceed to development, up to 275 new production floaters will be required over the next 10 to 15 years. A large backlog of eligible projects is significant – but only part of the picture in forecasting future production floater orders. Ultimately an investment decision is needed to transform these deepwater project opportunities into contracts for floating production facilities. In our forecast report we examine eleven underlying business drivers that will influence the timing and direction of future deepwater project investment decisions. Here’s how we see these eleven drivers at the moment.
In the positive category are
•oil and gas demand keeps growing
•supply disruption potential keeps the focus on finding new sources of supply
•long term oil/gas prices will rise, driven by demand/supply fundamentals
In the negative category are
•near term oil and gas prices have fallen to levels that discourage investment
•major energy companies have been cutting back on capital expenditures
•more supply has suddenly come into the oil and gas market
•shale/tight oil and gas projects are competing for investment funds
•local content constraints in the supply chain are creating delays and overruns
•Petrobras, the major customer, is having serious financial problems
•cost of capital for deepwater projects will rise over the next several years
In the unknown category are
•black swan events can (and have) disrupt the sector
Interaction of these drivers over the next few years will determine the number and timing of future production floater orders.
The Rebound Scenarios
Three plausible forecast scenarios are profiled in the report that capture a realistic range of underlying market conditions likely to prevail over the next five years.
•Low scenario: Sluggish global economic growth, decelerating energy demand, strong competition from shale oil, oil prices in the $50 to $60 range through 2020, local content policies pressure deepwater cost growth, Petrobras problems continue into 2017/beyond
•High Scenario: Strong economic growth, accelerating energy demand, oil prices in the $70 to $80 range through 2020, constraints limit shale development, easing local content policies reduce cost pressures in deepwater projects, Petrobras regains investment grade in H1 2016.
•Most Likely Scenario: Modest but sustained economic rebound, 1.5 percent energy demand growth, oil prices in the $60 to $70 range through 2020, shale oil grows in North America – but not elsewhere, deepwater cost growth decelerates, Petrobras credit junk rated through 2017.
In all scenarios the expected long term price of oil – on which major investment decisions are based – falls within the EIA projected future crude price range of $70 to $170 per barrel in the late-2020s, $80 to $200+ in the late 2030s.
Forecast for Orders
In the most likely scenario, over the next five years we expect orders for 64 oil/gas production units (FPSOs, Semis, Spars and TLPs), 29 LNG processing units (FLNGs, FSRUs) and 25 storage/offloading units (FSOs). Capex associated with the building and conversion contracts will be in the vicinity of $106 billion. A breakdown of the forecast by size unit, region, year order placed, new or modified hull, etc. is provided in the new report.
In the high scenario we anticipate a considerably stronger pace of orders. Here we expect orders for 77 oil/gas production floaters, 36 LNG processing units and 30 storage/offloading units. In the low scenario the number of orders is expected to be 45 oil/gas production floaters, 22 LNG processing units and 20 storage/offloading units.
The 2016/20 forecast is significantly lower than the five year forecast last year. There we projected orders for 98 oil/gas production units, 25 LNG processing units and 30 storage/offloading units.
Details for the production floater forecast are provided in our new 186 page report. Information about the report, including the table of contents and list of exhibits, is available at https://www.worldenergyreports.com/


